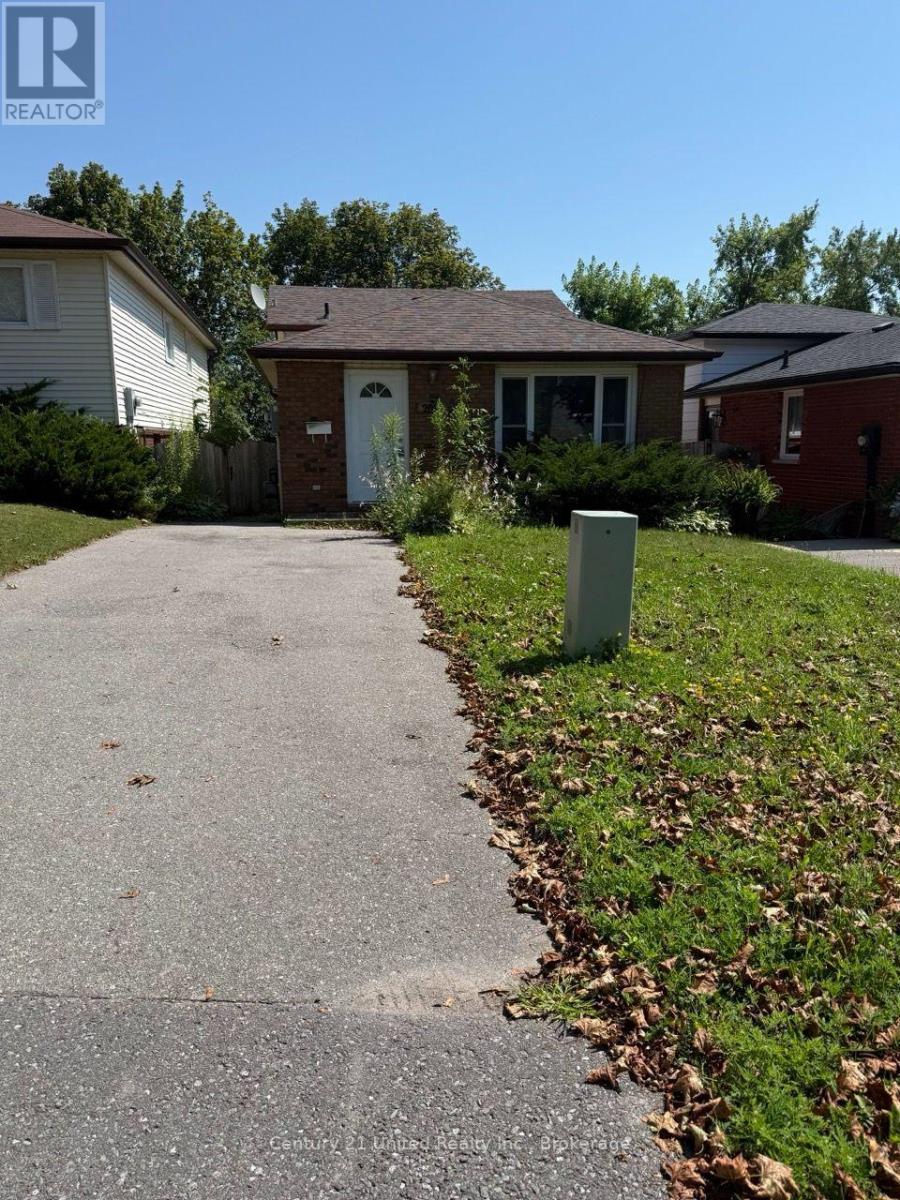
↓ 18.92%
Dropped yesterday
HomeDrops tracks Ontario lease listings daily, detecting rent drops, new inventory, and market signals before they become obvious.
Rent drops today
205
across 26 cities
Average rent drop
$182/mo
per reduced rental
Average drop %
5.4%
mean reduction
Largest rent drop
$3.5K/mo
Toronto (North Riverdale)
Monthly rent removed
$37.29K/mo
removed from asking rents
Cities ranked by today's rent drop count
City activity
26 active cities
205 listings reduced since the previous snapshot
561 properties entered the rental market today


Daily insight now, deeper trend reports as the history grows
Drops, new listings, and increases today
Explore report →Daily qualifying reductions over the latest week
Explore report →Recorded reductions by reporting month
Explore report →Free daily alerts
The largest drops, new inventory, and useful signals delivered once a day.